How AI Is Transforming Road Asset Inventory at Scale
How mobile mapping and machine learning are making comprehensive road asset inventory accessible to Indian municipalities.
Indian municipalities manage hundreds of kilometers of roads, usually with almost zero spatial data. Sending out engineers with clipboards is slow, wildly inconsistent, and forgotten the moment it's filed. By sticking a LiDAR scanner on a truck and running the pictures through an AI, we are finally changing what is actually possible on a municipal budget.
The data gap
Most Indian municipalities look after 100 to 500 kilometers of roads, but they have no map of what they actually own. Decisions about where to fix potholes or replace streetlights are driven by citizen complaints, local politics, or whichever engineer happens to remember a bad intersection.
There's no baseline. You can't prove things are getting better or worse. But now, Smart City grants and central government programs are demanding georeferenced asset databases before they release funds. The pressure is on to get this data fast.
The tech
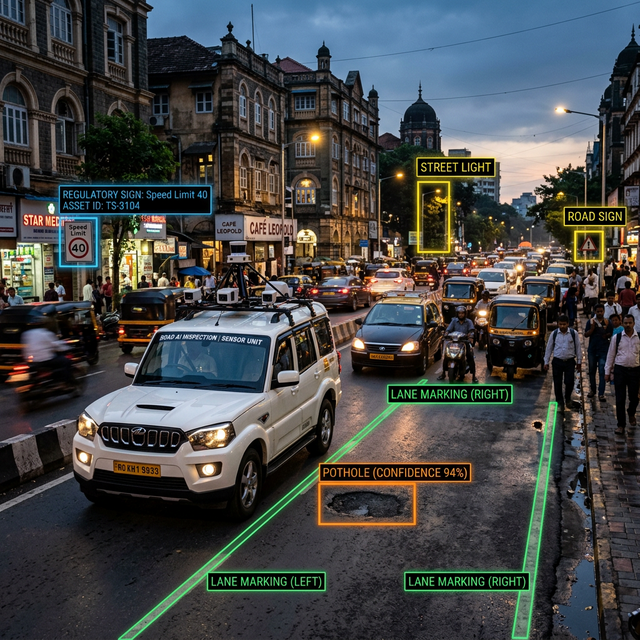
- Mobile Mapping: We mount LiDAR and 360-degree cameras on a vehicle and drive the network at normal traffic speeds. We can cover a 200 km city network in less than a week. We capture everything—the road surface, the curbs, the drains, the signs—in one pass.
- Panoramic Imagery: The LiDAR gets the geometry, but the cameras get the context. When we train an AI on both the shape and the color of an object, it catches things that either sensor would miss on its own.
- AI Detection: We run machine learning models over the data to spot potholes, cracks, broken signs, and clogged drains. Generic international AI models struggle here, so we train our models specifically on Indian road conditions, which are... unique.
- GIS Platform: We don't hand over a hard drive of raw point clouds. We deliver a spatial database with photos and condition scores, all loaded into a web GIS that a municipal engineer can actually use without needing a six-week software course.
How it happens
Phase 1: Driving the network The scanner truck drives the roads. It covers about 40 to 60 km a day. We grab everything, even the stuff you can't see from a satellite, like the underside of an underpass or a street sign hidden under a tree.
Phase 2: The algorithms take over Automated processing runs the pavement checks and classifies the street furniture. It's not magic—our QA team reviews the AI's math, fixes the weird mistakes, and makes sure the GPS traces line up with ground control points. For a 200 km network, the computers chew on it for about four to six days.
Phase 3: Delivery We load the data into a web dashboard and hand over the heat maps. The authority gets a report that says, "Here are the top 20 worst roads in the city, exactly where they are, and what it’s going to cost to fix them."
The invisible problems
When we run these projects for municipalities, the same thing happens every time: 30 to 40 percent of the broken assets we find were completely unknown to the public works department.
That isn't a failure of the engineers on the ground. It's just what happens when you try to manage a sprawling city network with a notebook and a scooter. The AI approach just turns that invisible backlog into a spreadsheet you can prioritize.
Why this actually matters
Cities everywhere face the same math: the infrastructure breaks down faster than humans can track it.
We already know that fixing a road right before it fails is vastly cheaper than rebuilding it after it falls apart. The barrier was always the staggering cost and time of finding out which road was about to fail.
Mobile LiDAR and AI have finally pushed the cost and speed down far enough that tier-2 and tier-3 Indian cities can afford it. It's no longer just for massive NHAI national highway projects.